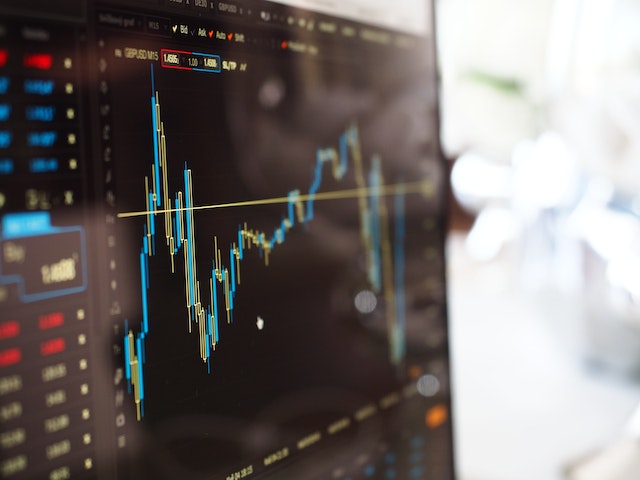
स्टॉक मार्केट ट्रेडिंग के लिए कोई एक सबसे अच्छा संकेतक नहीं है, क्योंकि विभिन्न संकेतक विभिन्न स्थितियों में और विभिन्न निवेश रणनीतियों के लिए उपयोगी हो सकते हैं। व्यापारियों और निवेशकों द्वारा आमतौर पर इस्तेमाल किए जाने वाले कुछ संकेतकों में शामिल हैं:

स्टॉक मार्केट ट्रेडिंग के लिए कोई एक सबसे अच्छा संकेतक नहीं है, क्योंकि विभिन्न संकेतक विभिन्न स्थितियों में और विभिन्न निवेश रणनीतियों के लिए उपयोगी हो सकते हैं। व्यापारियों और निवेशकों द्वारा आमतौर पर इस्तेमाल किए जाने वाले कुछ संकेतकों में शामिल हैं:
मूविंग एवरेज: इनका उपयोग एक निश्चित अवधि में स्टॉक के मूल्य आंदोलन की प्रवृत्ति की पहचान करने के लिए किया जाता है।
रिलेटिव स्ट्रेंथ इंडेक्स (RSI): यह सूचक किसी स्टॉक के हाल के मूल्य आंदोलनों की ताकत को मापता है ताकि यह निर्धारित किया जा सके कि यह ओवरबॉट या ओवरसोल्ड है।
बोलिन्जर बैंड्स: इनका उपयोग चलती औसत के आसपास मूल्य आंदोलनों की सीमा को मापकर स्टॉक की कीमत की अस्थिरता की पहचान करने के लिए किया जाता है।
एमएसीडी (मूविंग एवरेज कन्वर्जेंस डाइवर्जेंस): इसका उपयोग दो मूविंग एवरेज की तुलना करके स्टॉक के रुझान में बदलाव की पहचान करने के लिए किया जाता है।
वॉल्यूम: यह सूचक स्टॉक में व्यापारिक गतिविधि की मात्रा को मापता है और रुझान या प्रवृत्ति में संभावित परिवर्तनों की पहचान करने में मदद कर सकता है।
यह ध्यान रखना महत्वपूर्ण है कि केवल व्यापारिक निर्णयों के लिए किसी एक संकेतक पर निर्भर नहीं होना चाहिए। सूचित निवेश निर्णय लेने के लिए मौलिक विश्लेषण और जोखिम प्रबंधन रणनीतियों के साथ संकेतकों के संयोजन का उपयोग करने की अनुशंसा की जाती है। इसके अतिरिक्त, बाजार की बदलती स्थितियों के आधार पर अपने संकेतकों की लगातार निगरानी और समायोजन करना महत्वपूर्ण है।
There is no single best indicator for stock market trading, as different indicators can be useful in different situations and for different investment strategies. Some commonly used indicators by traders and investors include:
Moving averages: These are used to identify the trend of a stock’s price movement over a certain period of time.
Relative Strength Index (RSI): This indicator measures the strength of a stock’s recent price movements to determine if it is overbought or oversold.
Bollinger Bands: These are used to identify the volatility of a stock’s price by measuring the range of price movements around a moving average.
MACD (Moving Average Convergence Divergence): This is used to identify changes in a stock’s trend by comparing two moving averages.
Volume: This indicator measures the amount of trading activity in a stock and can help identify trends or potential changes in trend.
It’s important to note that no single indicator should be relied upon solely for trading decisions. It’s recommended to use a combination of indicators along with fundamental analysis and risk management strategies to make informed investment decisions. Additionally, it’s important to continually monitor and adjust your indicators based on changing market conditions.